Decoy Databases
Recently, there have been calls for greater stringency in the reporting of database search results.
Most notably, the initiative taken by the Editors of Molecular and Cellular Proteomics, who organised
a workshop in 2005 to define a set of guidelines. One of the guidelines is "For large scale experiments,
provide the results of any additional statistical analyses that indicate or establish a measure of
identification certainty, or allow a determination of the false-positive rate, e.g., the results of
randomized database searches or other computational approaches."
This is a recommendation to repeat the search, using identical search parameters, against a
database in which the sequences have been reversed or randomised. You do not expect to get any
true matches from the "decoy" database. So, the number of matches that are found is an
excellent estimate of the number of false positives that are present in the results from the real
or "target" database. This approach has been described in publications from Steven
Gygi's group, e.g. Elias, J. E., et al., Comparative evaluation of mass spectrometry platforms used
in large-scale proteomics investigations, Nature Methods 2 667-675 (2005).
If TP is true positive matches and FP is false positive matches, the number of matches in
the target database is TP + FP and the number of matches in the decoy database is FP.
The quantity that is reported is the False Discovery Rate (FDR) = FP / (FP + TP)
While this is an excellent validation method for MS/MS searches of large data sets, it is not
useful for a search of a small number of spectra, because the number of matches is too small
to give an accurate estimate. Hence, this is not a substitute for a reliable scoring scheme,
it is more a good way of validating it.
A decoy search can be performed automatically by choosing the
Decoy checkbox on the search form. If you prefer to create
a decoy database and search it separately, a utility for this purpose is available
below.
For an automatic decoy database search, choose the Decoy checkbox on the search form.
During the search, every time a protein
sequence from the target database is tested, a random sequence of the same
length is automatically generated and tested. The average amino acid composition of the random
sequences is the same as the average composition of the target database.
The matches and scores for the random sequences are recorded separately
in the result file. When the search is complete, the statistics for matches to the random
sequences, which are effectively sequences from a decoy database, are reported in the result header.
This screenshot shows an example of the decoy statistics for an MS/MS search:

Clicking on the Decoy link will load a report for the decoy search, just as if it was a
separate search of a decoy database.
This illustration is from a search of a Mudpit data set acquired on an Ion Trap. The limited mass accuracy and
signal to noise for this type of data usually results in the Mascot identity threshold being
conservative. The default significance threshold is 0.05, yet the false discovery rate
for matches above the identity threshold is a long way below this level. The false discovery
rate for the homology threshold is much closer to the predicted level, and produces a
much greater number of true positive matches. So, one option is to go with the matches above the
homology threshold and claim a false discovery rate of 4%. The other option is to go with the
smaller number of matches above the identity threshold, but with a false discovery rate of 0.3%.
If you change the significance threshold, and choose Format As, you will see the number
of matches and the false discovery rates change, so as to track the new threshold.
(The setting for the significance threshold must be less than 0.1). For example,
with a significance threshold of 0.099

For this data set, as is usually the case, the homology threshold gives the best sensitivity
for a given false discovery rate.
Conventionally, a decoy database search is only used for validating searches of MS/MS data.
It is not possible to get a false discovery rate for a peptide mass fingerprint, but it can be
informative to see the result of repeating a PMF search against a decoy database, especially
if the match from the target database is close to the significance threshold, or if there
is reason to think the experimental values or search parameters may be producing a false positive.
This screenshot shows an example of the decoy report for a PMF search:

A Perl script to reverse or randomise database entries can be downloaded here:
decoy.pl.gz. Unpack using
gzip or WinZip.
Note: We have had several reports that this file is unpacked automatically
when downloaded using Microsoft Internet Explorer on a Windows PC. If you cannot
open the file in Winzip, try to open it in a text editor like WordPad. If it looks
like text, then it has been unpacked, and you only need to rename the file to decoy.pl.
Execute
without arguments to get the following instructions.
Usage: decoy.pl [--random] [--append] [--keep_accessions] input.fasta [output.fasta]
- If --random is specified, the output entries will be random sequences
with the same average amino acid composition as the input database.
Otherwise, the output entries will be created by reversing the input
sequences, (faster, but not suitable for PMF or no-enzyme searches).
- If --append is specified, the new entries will be appended to the input
database. Otherwise, a separate decoy database file will be created.
- If --keep_accessions is specified, the original accession strings will
be retained. This is necessary if you want to use taxonomy and the
taxonomy is created using the accessions, (e.g. NCBI gi2taxid).
Otherwise, the string ###REV### or ###RND### is prefixed to each
original accession string.
- You cannot specify both --append and --keep_accessions.
- An output path must be supplied unless --append is specified.
- If the database is nucleic acid, no need to specify --random. A
simple reversal will effectively randomise the translated proteins
Title line processing assumes that the accession string is between the ">" character
and the first white space. If this is not the case, the title lines may not be exactly as intended.
Note that you may have to adjust existing Mascot parse rules to allow for changes to the title line.
To illustrate how you would use this script on a Mascot server, assume you have NCBInr
already set up.
- Choose a name for the decoy database and create a directory structure, as described
here
- Copy decoy.pl to the Mascot bin directory
- From a command or shell prompt, change to the Mascot bin directory
- Execute the script. For example, under Windows:
decoy.pl --keep_accessions --random ..\sequence\NCBInr\current\NCBInr_20060301.fasta
      ..\sequence\random\current\NCBInr_random_20060301.fasta
(should be entered as one line)
- In the database maintenance utility, first select NCBInr, then click on the
"New definition" button at the bottom. Change the name to (say) NCBInr_random
and modify the path for the Fasta file. Choose the Test button. If all is OK, choose
the Apply button
- When you next update NCBInr, update the randomised version by first creating a new file
in the random\incoming directory, then moving it to the random\current directory
The Gygi group advocate searching a database in which the target and decoy sequences have been
concatenated. This means that you will only record a false positive when a match from the decoy
sequences is better than any match from the target sequences. A more conservative approach is to
search the two databases independently. If the Mascot score threshold for a given spectrum is
(say) 40, and we get a match of 60 from the target database and 50 from the decoy database, this
would not count as a false positive from a concatenated database, but it would count as a false
positive if the two had been searched independently.
There is also the question of whether to reverse or randomise. If you simply reverse a sequence,
and then do the search without enzyme specificity, you may get a misleading picture of the false
positive rate because, sometimes, you will get a mass shift at each end of a reversed peptide that
just happens to transform a genuine y series match into a false b series match or vice versa.
Similarly, a reversed database is not suitable for verifying a peptide mass fingerprint score,
because half of the tryptic peptide mass values will be unchanged. (Those that have the same
residue at the C-terminus and flanking the N-terminus).
One objection to using a randomised database for a tryptic search is that the total number of
peptides changes, because real protein sequences are not random, and because the target database
will have some degree of redundancy, which is lost on randomisation. This could certainly be a problem
for an arbitrary scoring function, where you want the same number of trials in the normal and
decoy databases. It is not a problem for Mascot because the score threshold is derived from the
number of trials. If the randomised database generates a higher or lower number of tryptic
peptides for a given spectrum, this will translate to a higher or lower significance threshold,
and the measured false positive rate is accurate. So, for Mascot, we suggest that a randomised
database is the better choice all round.
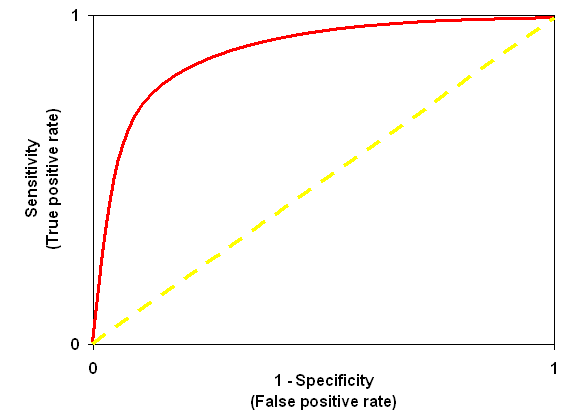
The performance of a scoring scheme is sometimes illustrated as a Receiver-Operating
Characteristic or "ROC Curve". This plots true positive rate and false positive
rate as a function of a discriminator, such as a score threshold.
A good scoring scheme will try to follow the axes, as illustrated by the red curve, pushing
its way up into the top left corner. A useless scoring algorithm, that cannot distinguish
correct and incorrect matches, would follow the yellow dashed diagonal line.

The origin of the ROC
curve has unit specificity, i.e. zero false positives, but also zero true positives.
Not a useful place to be. The top right of the ROC curve has unit sensitivity, i.e. 100%
true positives, but also 100% false positives, which is equally useless. By setting a
significance threshold in Mascot, you effectively choose where you want to be on the curve.
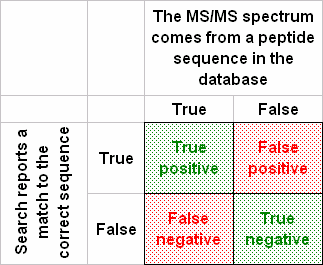
A ROC curve is designed to illustrate a so-called binary classifier. In our case, an
MS/MS spectrum either represents a peptide in the database or it does not. The search engine
is the classifier, which either succeeds or fails to report the correct match.

To plot an authentic ROC curve, we need estimates of the numbers of true negatives (TN) and
false negatives (FN), because true positive rate = TP / (TP + FN) and false positive rate =
FP / (FP + TN). However, for real-life datasets, where we are dealing with unknown samples,
we do not know TN and FN. So, what is presented as a ROC curve is often just a plot of the
fraction of spectra matched in the target database versus the fraction matched in the decoy,
or something similar.
In most searches, a proportion of the spectra are
unmatchable for all sorts of reasons. Some spectra are non-peptidic, or little more than noise; others cannot be matched
because the sequence is not in the database or the peptide is modified in a way that is not part
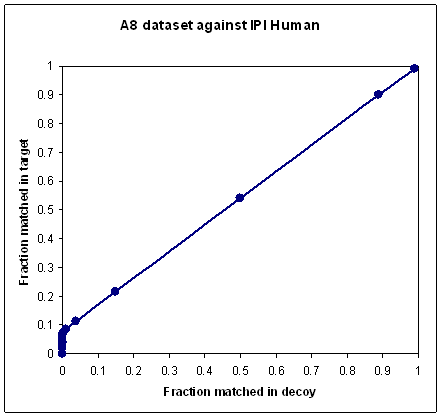
of the search. If you plot a ROC-style curve for the typical MudPIT data set, where it is quite normal for
90% or more of the spectra to be unmatchable, you will get a very poor looking curve,
because no scoring scheme can discriminate the unmatchable spectra. In other words, as the score threshold is
reduced towards zero, additional matches are equally likely to come from the decoy as from the target, and the
ROC curve tends towards a diagonal line, as shown in the first plot.


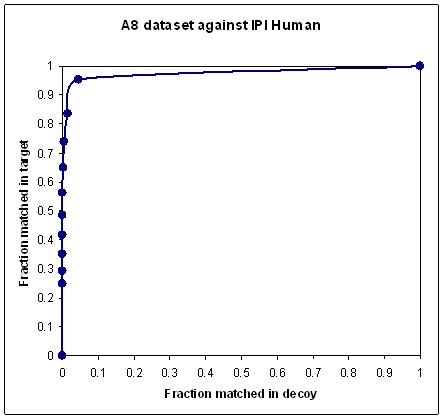
To obtain a nice looking curve, like the second plot, you must somehow exclude the unmatchable spectra.
This is where the problem lies. Deciding which spectra to exclude can be somewhat arbitrary. Clearly, if you reduce
a dataset to a handful of the highest quality spectra, then any scoring scheme will give a beautiful curve.
So, a nice looking curve by itself doesn't prove that a scoring scheme is any good;
it may just be the result of cherry-picking the higher quality spectra.
If you want to plot a ROC-style curve, or if you performed
a manual decoy search and want to determine the false discovery rate, you need a utility to tabulate
the numbers of target and decoy matches over a range of score thresholds. A script for this purpose
can be downloaded here: fdr_table.pl.gz.
Unpack using gzip or WinZip.
Note: We have had several reports that this file is unpacked automatically
when downloaded using Microsoft Internet Explorer on a Windows PC. If you cannot
open the file in Winzip, try to open it in a text editor like WordPad. If it looks
like text, then it has been unpacked, and you only need to rename the file to fdr_table.pl.
Copy the script to the Mascot cgi directory and execute without arguments to get the following usage instructions:
Tabulate target-decoy FDR data for plotting ROC curves, etc.

If using a concatenated database, decoy accession strings
must include _REVERSE or ###REV### or _RANDOM or ###RND###

The program must be run from the mascot cgi directory

Usage:   fdr_table.pl file thresh_type start end num_vals

Example: fdr_table.pl ../data/20060503/F123456.dat identity 0.01 10 20

         file is the path to a Mascot results file
         thresh_type is either identity or homology
         start is the lowest calculated expectation value
         end is the highest calculated expectation value
         num_vals is the number of rows to output, incl. start and end
|